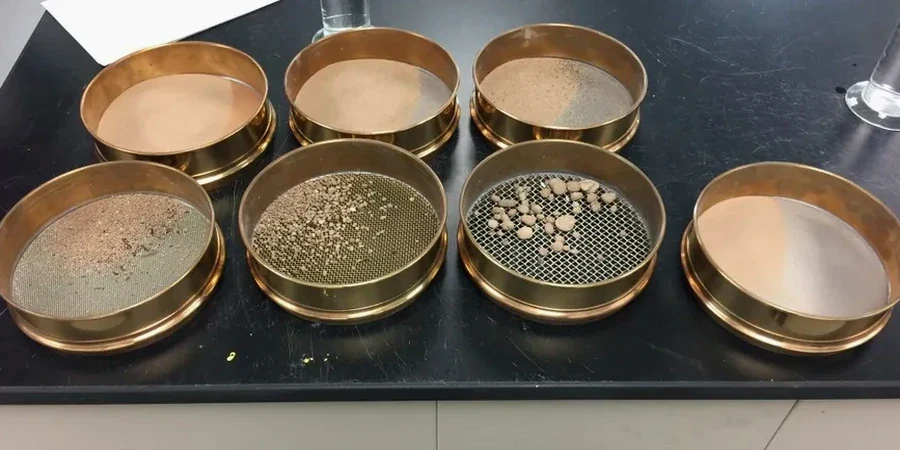
Norfolk’s urban fabric sits on a landscape shaped by the Chesapeake Bay impact crater and centuries of river sedimentation. Much of the city is underlain by the Tabb Formation and younger Holocene marsh deposits, which means the soils here can shift from clean sands near the Lafayette River to highly plastic silts just a few blocks inland. When we run a grain size analysis combining sieve and hydrometer, we are not just generating a curve—we are tracing the depositional history that dictates how a foundation will perform. In our lab, the full test spans from the No. 200 sieve down to the colloidal fraction, providing the data needed for a reliable USCS classification under ASTM D2487. For preliminary exploration, a test pit lets us observe the stratigraphy hands-on before sampling, giving context that a split-spoon sample alone cannot capture.
A complete grain size curve—from gravel to colloids—is the single most cost-effective test to understand Norfolk's layered coastal deposits.
How we work
Local ground factors
The humidity here is relentless—Norfolk averages over 45 inches of rain a year, and the water table sits shallow across much of the city. This moisture regime has a direct effect on grain size testing: a sample that dried out during transport can give you a misleading fines percentage because silt and clay clods harden into sand-sized aggregates. We pre-wash every specimen through the No. 200 sieve and recover the fines for hydrometer analysis, which prevents that classic mistake. The bigger risk we encounter is skipping the hydrometer altogether. If you only run a sieve analysis on a silty sand from a site near the Hague, you might call it clean sand with 4% fines—when the hydrometer reveals 18% clay that will hold water and reduce bearing capacity. That is the kind of oversight that turns a straightforward footing design into a long-term settlement problem, particularly where tidal fluctuations keep the ground saturated.
Regulatory framework
ASTM D6913/D6913M-17, ASTM D7928-21, ASTM D2487-17e1
Related services
Complete gradation package
Sieve analysis from 3-inch down to No. 200 combined with hydrometer sedimentation for the sub-75-micron fraction. You receive a full semi-log plot, USCS classification, and a brief interpretive note on the likely engineering behavior of the soil.
Wash-sieve only (sand fraction)
For concrete sand, backfill material, or filter aggregates where the fines content just needs to pass a threshold. We run a washed sieve analysis per ASTM C117/C136 and report the percentage passing No. 200 along with the gradation of the retained fraction.
Troubleshooting non-standard samples
Norfolk marine clays and organic silts sometimes flocculate during hydrometer testing. We adjust dispersant concentration, run parallel specimens, and can extend the reading schedule to 48 hours when the suspension remains cloudy, ensuring the clay fraction is not underestimated.
Typical parameters
Quick answers
What is the typical turnaround time for a grain size analysis in your Norfolk lab?
A standard sieve-plus-hydrometer test takes five to seven working days from sample receipt. If you need the sieve portion faster—say, to confirm a sand spec for concrete—we can usually turn the washed sieve analysis in two days and follow up with the hydrometer data later. Highly organic clays that need extended sedimentation readings may add a day or two.
How much sample do you need for a full hydrometer test?
For most Norfolk soils, 500 grams of dry material is sufficient if the soil is predominantly sand. For silts and clays, 200 grams is plenty because the hydrometer test only uses about 50 grams of the minus-No. 200 fraction. If you are not sure, send us a quart-sized bag and we will split it in the lab.
What does a grain size analysis cost in Norfolk?
A complete sieve-plus-hydrometer analysis typically runs between US$100 and US$180 depending on whether we need to dry and disaggregate the sample extensively, and how many reading intervals the hydrometer phase requires. A simple wash-sieve without hydrometer falls on the lower end of that range.
Do you report the USCS group symbol and group name?
Yes, every grain size report includes the full ASTM D2487 classification—group symbol like SP-SC or CL—along with the group name. If we also have Atterberg limits data for the same sample, we combine both to give you a definitive classification rather than a provisional one based on gradation alone.
Can the hydrometer test work on soils with organic content from Norfolk marsh deposits?
It can, but organic fines require extra care. We pre-treat the sample with hydrogen peroxide to oxidize organic matter before dispersion, following ASTM D7928 procedures. Without that step, organic colloids keep the suspension cloudy and the hydrometer readings drift, giving you an artificially high clay fraction.